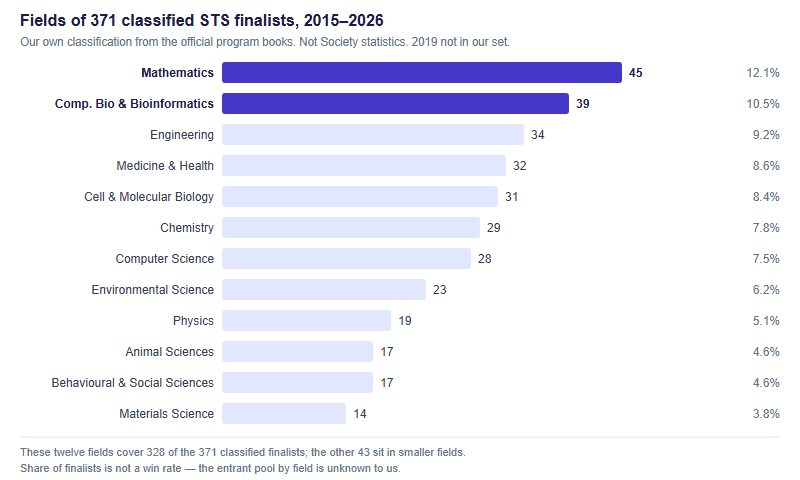
We read eleven editions of the official Regeneron Science Talent Search program books and classified the research field of 371 of roughly 440 top-40 finalists. Over those eleven years Mathematics is the single largest field at 45 finalists (12.1%), with Computational Biology & Bioinformatics second at 39 (10.5%). Before anything else: STS is for U.S. high school seniors only.
Before the numbers: who can actually enter STS
This matters more than any figure below, so it goes first.
The Science Talent Search is for U.S. high school seniors. A student at a school in mainland China cannot enter it; the realistic route there is Regeneron ISEF, reached by winning at a Society-affiliated fair. Students on a U.S. high-school path — including Chinese students studying at U.S. high schools — are the ones for whom STS is in scope. We will not blur that line to make an article feel more relevant than it is.
With that established, here is what the competition actually is, drawn from the program books and societyforscience.org:
- It has run since 1942 and is a programme of Society for Science. The books describe it as “the nation's oldest and most highly regarded science competition for high school seniors”.
- Sponsors in order: Westinghouse, then Intel, then Regeneron. Regeneron's commitment is described as ten years and $100 million.
- There is no qualifying fair. Entry is by direct application: an extensive submission including a written research report plus supporting documentation from schools, advisors and mentors.
- Evaluators and judges “select 300 scholars and 40 finalists from the entrant pool”. The top 40 attend a finals week in Washington, D.C. and display their research publicly.
- Every finalist entry is a single-author original research project.
- In 2026, finalists competed for more than $1.8 million; the total annual distribution is $3.1 million.
Note the structural difference hiding inside those bullets: STS judges a written body of work submitted directly by an individual senior, while ISEF judges a project that has already survived a fair. Two selection machines — and two different ways of naming what a project is about.
How we built this dataset, and the four things it cannot tell you
The whole value of this article is a compilation nobody has published, so you are entitled to the method before the findings.
We worked from the official program books for eleven editions and assigned each finalist's project to a research field, based on how the book itself phrases what the project is about. The classification is ours. These are not Society statistics and must never be quoted as such. We could classify 371 of roughly 440 finalists; per-year coverage runs from 29 of 40 up to a complete 40 of 40. 2019 has no program book in our set and is a gap — there are eleven years of data here, not twelve.
The books are Society for Science copyright, and the Society's Rights & Permissions terms require permission to republish. So this piece contains no finalist write-ups, no project descriptions and no profile text, and no student names. Everything here is our own characterisation at the level of fields and patterns.
Four limits, stated up front rather than buried:
- Category share is not a win rate. To compute a win rate you need the denominator — how many students entered in each field — and the entrant pool is unknown to us. A field with 45 finalists may have had many more applicants than a field with 14. We cannot tell you, and neither can anyone else working from the books alone.
- The labels are judgement calls. A protein-structure prediction project could sit under computational biology, computer science or cell and molecular biology depending on which sentence you weight. We were consistent; a different reader would still move some projects.
- Coverage varies, so early years are thinner. 2015 gave us 29 classifiable projects; 2025 and 2026 gave us 40. Any apparent broadening of the field over time is partly this.
- This is the top 40 only. It says nothing about the 300 scholars, and nothing about the shape of the applicant pool below them.
The eleven-year picture: twelve fields, 328 of 371 finalists
Here is the aggregate. The twelve largest fields account for 328 of the 371 classified finalists — 88.4% — with the remaining 43 spread across smaller fields including neuroscience, space science, plant sciences and genomics, each of which does appear in individual years further down this page.
| Field (our classification) | Finalists, 2015–2026 | Share of 371 |
|---|---|---|
| Mathematics | 45 | 12.1% |
| Computational Biology & Bioinformatics | 39 | 10.5% |
| Engineering | 34 | 9.2% |
| Medicine & Health | 32 | 8.6% |
| Cell & Molecular Biology | 31 | 8.4% |
| Chemistry | 29 | 7.8% |
| Computer Science | 28 | 7.5% |
| Environmental Science | 23 | 6.2% |
| Physics | 19 | 5.1% |
| Animal Sciences | 17 | 4.6% |
| Behavioural & Social Sciences | 17 | 4.6% |
| Materials Science | 14 | 3.8% |
Year by year, with coverage shown honestly
The table below lists, for each edition, how many of the 40 finalists we could classify and every field with two or more classified finalists that year, in order. Fields with a single finalist in a given year fall below that listing threshold and do not appear — which is why the columns will not sum to the eleven-year totals above. The aggregate counts include those single appearances; the year rows do not.
| Year | Classified | Fields with two or more classified finalists |
|---|---|---|
| 2015 | 29 / 40 | Mathematics 5; Engineering 4; Chemistry 4; Plant Sciences 2; Animal Sciences 2; Comp. Bio & Bioinformatics 2; Computer Science 2; Physics 2; Materials Science 2 |
| 2016 | 29 / 40 | Engineering 5; Comp. Bio & Bioinformatics 3; Cell & Molecular Biology 3; Materials Science 3; Mathematics 3; Physics 3; Environmental Science 2; Computer Science 2; Medicine & Health 2 |
| 2017 | 30 / 40 | Medicine & Health 6; Mathematics 5; Cell & Molecular Biology 3; Chemistry 3; Engineering 3; Comp. Bio & Bioinformatics 3; Behavioural & Social Sciences 2; Space Science 2 |
| 2018 | 32 / 40 | Mathematics 6; Cell & Molecular Biology 5; Chemistry 4; Computer Science 4; Physics 3; Engineering 3; Plant Sciences 2; Genomics 2 |
| 2019 | — | No program book in our set. This year is a gap in the dataset. |
| 2020 | 32 / 40 | Comp. Bio & Bioinformatics 5; Environmental Science 5; Mathematics 4; Cell & Molecular Biology 3; Engineering 3; Medicine & Health 2; Plant Sciences 2; Animal Sciences 2 |
| 2021 | 34 / 40 | Comp. Bio & Bioinformatics 5; Medicine & Health 5; Mathematics 5; Cell & Molecular Biology 3; Chemistry 3; Engineering 3; Materials Science 2; Environmental Science 2; Physics 2; Neuroscience 2 |
| 2022 | 37 / 40 | Comp. Bio & Bioinformatics 6; Behavioural & Social Sciences 5; Engineering 5; Environmental Science 5; Computer Science 4; Mathematics 3; Physics 2; Animal Sciences 2 |
| 2023 | 30 / 40 | Chemistry 4; Mathematics 4; Cell & Molecular Biology 4; Environmental Science 3; Neuroscience 3; Computer Science 3; Comp. Bio & Bioinformatics 2; Medicine & Health 2 |
| 2024 | 38 / 40 | Cell & Molecular Biology 5; Medicine & Health 4; Engineering 4; Neuroscience 4; Computer Science 3; Mathematics 3; Comp. Bio & Bioinformatics 3; Environmental Science 2; Space Science 2; Materials Science 2; Animal Sciences 2; Chemistry 2 |
| 2025 | 40 / 40 | Medicine & Health 4; Comp. Bio & Bioinformatics 4; Animal Sciences 4; Computer Science 3; Chemistry 3; Cell & Molecular Biology 3; Mathematics 3; Space Science 3; Materials Science 2; Neuroscience 2; Behavioural & Social Sciences 2; Physics 2; Environmental Science 2; Engineering 2 |
| 2026 | 40 / 40 | Comp. Bio & Bioinformatics 5; Computer Science 5; Mathematics 4; Medicine & Health 4; Space Science 3; Animal Sciences 3; Chemistry 3; Behavioural & Social Sciences 2; Materials Science 2; Physics 2; Neuroscience 2; Engineering 2; Cell & Molecular Biology 2 |
Two things stand out. First, Mathematics is the only field appearing in every one of the eleven year rows, and never below three — never spectacular, its high being six in 2018, but never absent. That is what a sustained pipeline looks like. Second, no field owns the competition: even the largest is roughly one in eight.
The computational turn is real, and it is not what people assume
The clearest movement in eleven years is Computational Biology & Bioinformatics. It sat outside the top four in both 2015 and 2018. It then finished first or joint-first in 2020, 2021, 2022 and 2026 — four of the last seven editions in our set.
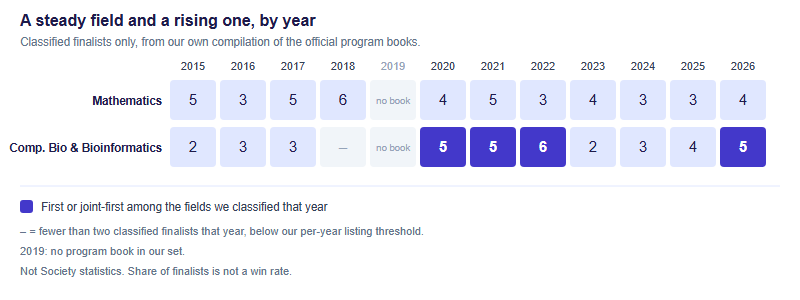
Now the part that is routinely misread. Computational method spread into biology and medicine; it did not replace them. Cell & Molecular Biology totals 31 over eleven years and led the 2024 table with five. Medicine & Health totals 32 and sat joint-top in 2025 with four. Neither collapsed. What changed is that biological questions answered with computational tools became numerous enough to form their own visible block.
That is a claim about method, not about subject. A student reading this as “stop doing biology, start doing code” has drawn precisely the wrong conclusion. The defensible reading is: an increasing share of strong senior-year research now involves substantial computation, wherever the question comes from — and being unable to handle data is becoming a limit on what questions you can attempt.
What this does and does not tell you — and how ISEF differs
Let us be blunt about the misuse this data invites.
It does not say “pick mathematics to win”. Forty-five finalists over eleven years tells you how many mathematics projects reached the top 40; it tells you nothing about how many were submitted. If mathematics also attracts the most entrants, its finalist share could reflect a lower success rate than a smaller field. We cannot compute that and neither can you, from these books. Anyone who quotes a “best category” from finalist counts alone is doing arithmetic without a denominator.
What it does say is which fields sustain a pipeline — which ones produce work at this level year after year rather than in one lucky cohort. Mathematics, computational biology, engineering, medicine, cell and molecular biology and chemistry all clear 29 finalists across the period. Those are fields where a senior working alone can reach a defensible original result — useful to know at fifteen or sixteen, when the real question is whether your interest can produce a completable project at all.
Finally, the contrast with ISEF, because the two are constantly conflated.
| Science Talent Search | Regeneron ISEF | |
|---|---|---|
| Who may enter | U.S. high school seniors | Grades 9–12, individual or a team of up to three |
| How you get in | Direct application — no qualifying fair | By winning at a Society-affiliated local, regional, state or national fair |
| Scale | 300 scholars and 40 finalists from the entrant pool | More than 1,700 finalists in 2026, from 365 affiliate fairs in more than 60 countries, regions and territories |
| Fields | No fixed category list used here — the twelve fields above are our labels | Finalists compete across 22 different scientific categories defined by the Society |
| Running since | 1942 | 1950 |
The practical consequence: do not map our twelve STS fields onto ISEF's 22 categories. They are different taxonomies applied to different, differently-selected populations, and ISEF's field is more than forty times larger at the finals stage. If you are entering ISEF, work from the Society's own definitions — we walk through all of them in our guide to the 22 ISEF categories, and the structure of the competition itself is covered in what ISEF is and how ISEF works. The 2026 fair ran 9–15 May in Phoenix. We are separately told the 2027 fair returns to Los Angeles in May 2027; that comes through our own organisation's channels rather than a Society announcement, so confirm it on societyforscience.org before you plan around it.
The most useful signal in eleven years of books is not which field wins. It is that a single student, working alone, can reach a displayable result in fields as different as pure mathematics and animal sciences. The field is not the constraint. The question is.
Frequently asked questions
Can a student in mainland China enter the Science Talent Search?
No. STS is for U.S. high school seniors. The realistic route is ISEF, qualified through a Society-affiliated fair.
Does Mathematics leading at 12.1% mean it is the easiest category to win?
No. Finalist share is not a win rate. The number of entrants per field is unknown to us, so no success rate can be computed.
Are these official Society for Science statistics?
No. They are our own classification of 371 of roughly 440 finalists, based on how each program book phrases the project's field.
Why is 2019 missing from the dataset?
We have no 2019 program book in our set. That edition is a gap, so this is eleven years of data, not twelve.
This is an independent guide operated by Hanlin Education for China-based international-school students. We are not affiliated with, endorsed by, or sponsored by the Society for Science, the Regeneron Science Talent Search or Regeneron ISEF. The finalist-field figures on this page are our own compilation from the official program books and are not Society statistics; the books themselves remain Society for Science copyright and are not reproduced here. Confirm current rules, eligibility and dates on societyforscience.org. Errors are corrected within 7 working days.