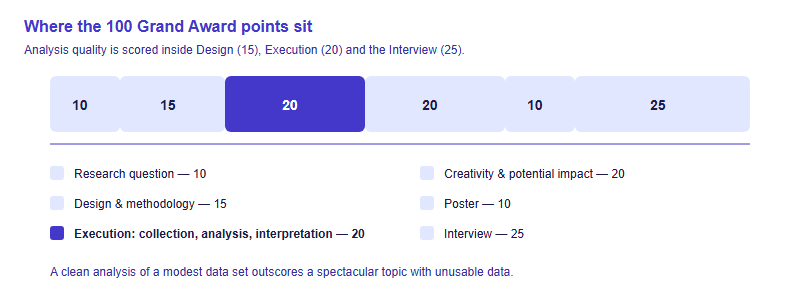
ISEF judging is published, and it names statistics directly. Execution — data collection, analysis and interpretation — carries 20 of the 100 Grand Award points and asks for systematic analysis, reproducible results, appropriate mathematical and statistical methods, and enough data to support your conclusions. Most of that is decided in July, when you design the study, not in March when you run the numbers.
Where statistics actually earns points
Society for Science publishes the Grand Award criteria as a 100-point structure. Reading it as a student, the useful move is to ask which sections your analysis touches — and the answer is three of them, not one.
| Criterion | Points | Where your analysis shows up |
|---|---|---|
| Research question / engineering problem | 10 | Whether the question is testable at all — a question no measurement can settle cannot be analysed |
| Design and methodology | 15 | Variables and controls defined, appropriate and complete; the data-collection plan that makes analysis possible |
| Execution: data collection, analysis, interpretation | 20 | Systematic collection and analysis, reproducibility, appropriate statistical methods, sufficient data |
| Creativity and potential impact | 20 | Creativity can live in the analysis itself, not only in the topic |
| Presentation — poster | 10 | Graphics that communicate the result clearly |
| Presentation — interview | 25 | Explaining why you chose an analysis, and what it can and cannot show |
The framing to carry into your summer is this: judges are not asking whether you used advanced statistics. They are asking whether the numbers you show can actually support the sentence you say out loud at the booth. A modest data set analysed honestly beats an ambitious data set analysed loosely, every time.
The analysis decisions you must make before collecting data
Statistics is usually taught as something you do after data arrives. In competition research it is the reverse: the choices that determine whether your analysis will work are all made at design stage, before the approval date on your forms. Four of them matter most.
- What is your unit of analysis? If you grow 30 plants in three trays and one tray gets more light, your independent unit may be the tray, not the plant. Measuring 30 plants does not give you n = 30 if they share a condition. This is pseudo-replication, and it is the most common structural error in school science projects.
- How many independent replicates can you actually run? Decide the number before you start, based on time, cost and access — not after seeing whether the first results look promising. Adding samples until a difference appears is a different experiment from the one you designed.
- What is your control or baseline? An engineering prototype needs a benchmark; a treatment needs an untreated comparison; a survey needs a comparison group or a pre-existing reference. Without one, no analysis can separate your effect from ordinary variation.
- What will you do about variables you cannot control? Randomise assignment where possible, hold conditions constant where not, and record the ones you can only measure. Judges reward variables and controls that are defined, appropriate and complete — that phrase sits inside the 15-point design criterion.
Write these four answers into your research plan while you are drafting it. If your project involves people, animals or biological agents, the plan is also going to a review committee before you begin — and a plan that specifies its own analysis reads as a serious study rather than a first attempt.
Matching the analysis to your design
You do not need an exotic method. Nearly every pre-college project maps onto a small set of standard comparisons. The rule is simple: the design determines the test, and the test does not change because you dislike the result.
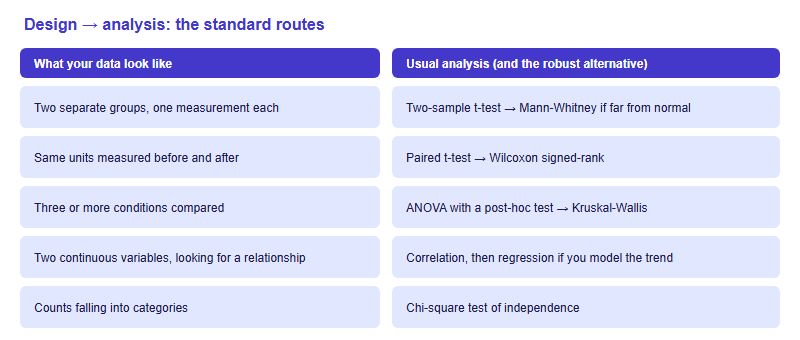
Three practical notes on using this map honestly. First, the robust alternatives on the right exist because real school data are often small, skewed or ordinal — using them is a sign of care, not weakness. Second, if you compare many outcomes at once, the chance of finding something “significant” by accident rises; say so, and separate your planned comparison from exploratory ones. Third, an engineering project is not exempt. Repeated trials of a prototype vary, so report the spread across trials and compare against a benchmark — that is the engineering equivalent of the same discipline, and it is why our comparison of how the categories frame a project is worth reading before you settle your methods.
What to report so a judge can verify you
The execution criterion asks for reproducibility and sufficient data. In practice a judge is checking whether they could reconstruct your claim from what is on the board. A complete result statement contains five things:
| Element | Why judges look for it | Weak version | Strong version |
|---|---|---|---|
| Sample size (n) | Sets how much weight any difference can carry | “The treated group grew more.” | “n = 12 independent trays per condition.” |
| Centre and spread | A mean without variability hides the whole story | Mean only | Mean with standard deviation, defined in the caption |
| The test used | Shows the analysis matches the design | “Statistics were done.” | “Two-sample t-test; normality checked on residuals.” |
| Result with uncertainty | Distinguishes a signal from noise | “It was significant.” | Test statistic, p-value, and a confidence interval where available |
| Effect size and meaning | Answers the “so what” question judges always ask | “p < 0.05” | “A 14% mean increase — roughly one extra leaf per plant.” |
Two formatting habits do a surprising amount of work at the booth. Define every error bar in the figure caption — standard deviation, standard error and confidence interval look identical and mean different things, and a judge who cannot tell which one you plotted cannot credit the figure. And give each graph a single sentence of takeaway text underneath, so a judge walking past reads your interpretation rather than guessing it. Our ISEF project preparation guide places this reporting stage in the wider build, between running the experiment and preparing for judging.
The analysis mistakes that cost the most points
- Pseudo-replication. Treating repeated measurements of the same unit as independent samples inflates n and invalidates the test. Fix it in July by defining your unit of analysis.
- Bar charts of means with no variability shown. The single most common poster weakness. Add error bars, or plot the individual data points — with small samples, showing every point is often more honest and more persuasive.
- Testing everything, reporting the winner. If you ran twelve comparisons and present one, say so. Judges who ask “what else did you test?” are checking exactly this.
- Causal language from correlational data. Surveys and observational studies support association, not cause. Rewrite “screen time causes poorer sleep” as “screen time was associated with shorter reported sleep” — and be ready to name the confounders you could not control.
- No plan for a null result. A well-designed study that finds no effect is a legitimate result, and interpreting it well demonstrates exactly the maturity the interview rewards. A study that quietly changes its question after the data disappoint is a much weaker project — and if you are running a multi-year line, it also raises the separate question of what makes next year’s work a genuine expansion rather than a re-run.
An editorial observation from working with students in this system: the analysis section is where projects from well-equipped labs and projects from school benches converge. You cannot borrow instrumentation, but you can absolutely match anyone on whether your comparison was fair, your n was honest, and your claim was proportionate to your evidence. That is also why the judging structure rewards students whose work is genuinely their own — see our overviews of what ISEF is and how a project travels from an affiliated fair to the finals for how the whole pipeline fits together.
Frequently asked questions
How much data is enough for an ISEF project?
Enough to support your conclusions — that is the standard in the published execution criterion. Decide the number of independent replicates at design stage, not after seeing early results.
Do I need advanced statistics to score well?
No. Judges look for methods appropriate to the design. A correctly chosen basic test, honestly reported, beats a complex model applied to unsuitable data.
What if my results are not significant?
A null result is a real result. Report it, discuss the limits of your design, and be ready to explain what a larger or different study would need.
Should raw data go on the board?
Summaries belong on the board; keep raw data and your analysis records available to show judges. A project data book is not required but is strongly recommended.
This is an independent guide operated by Hanlin Education for China-based international-school students. We are not affiliated with, endorsed by, or sponsored by the Society for Science or Regeneron ISEF. Judging criteria and rules change each cycle — confirm current details on societyforscience.org. Any factual error reported to our editorial desk is corrected within 7 working days.